Power BI
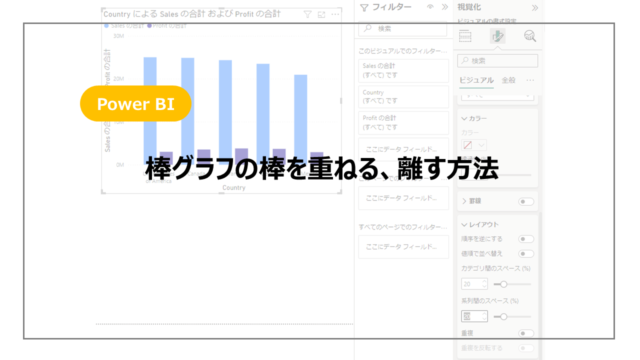
Power BI 棒グラフの棒を重ねる、離す方法
2024年10月14日 ria DataSeeds~データエンジニアの備忘録~
Power BI
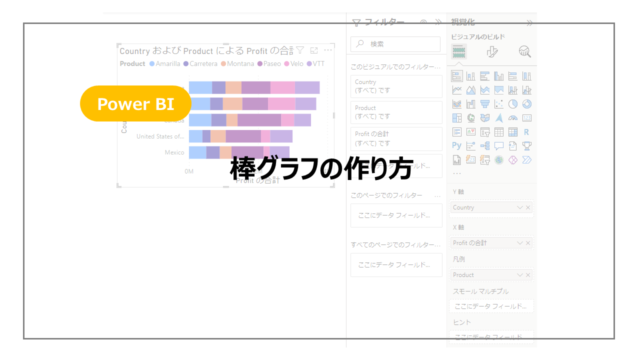
Power BI 棒グラフの作り方
2024年10月7日 ria DataSeeds~データエンジニアの備忘録~
Power BI
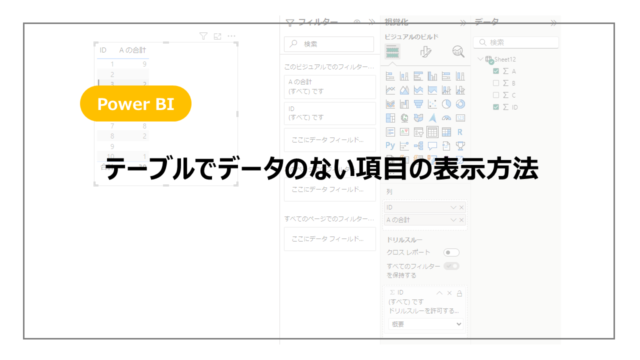
Power BI テーブルでデータのない項目の表示方法
2024年9月30日 ria DataSeeds~データエンジニアの備忘録~
Power BI
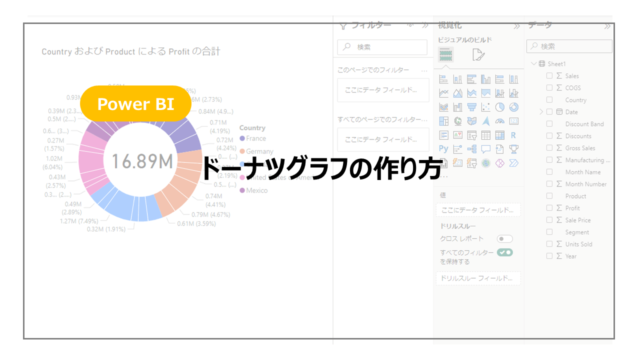
Power BI ドーナツグラフの作り方
2024年9月23日 ria DataSeeds~データエンジニアの備忘録~
Power BI
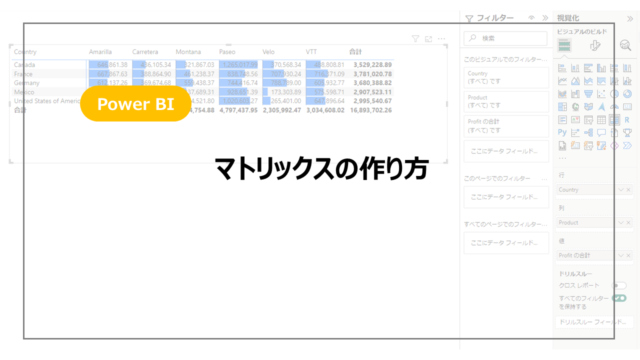
Power BI マトリックス(クロス集計表)の作り方
2024年9月9日 ria DataSeeds~データエンジニアの備忘録~

Looker Studio
おすすめ無料BIツール。ビジネス利用だけでなく学習利用にも!
2024年9月2日 ria DataSeeds~データエンジニアの備忘録~
Power BI
Power BI 折れ線グラフの線を非表示にする方法
2024年8月26日 ria DataSeeds~データエンジニアの備忘録~