Power BI
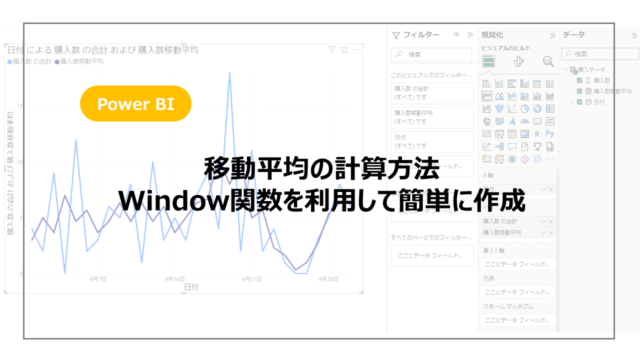
Power BI 移動平均の計算方法。Window関数を利用して簡単に作成
2024年4月15日 ria DataSeeds~データエンジニアの備忘録~
Power BI
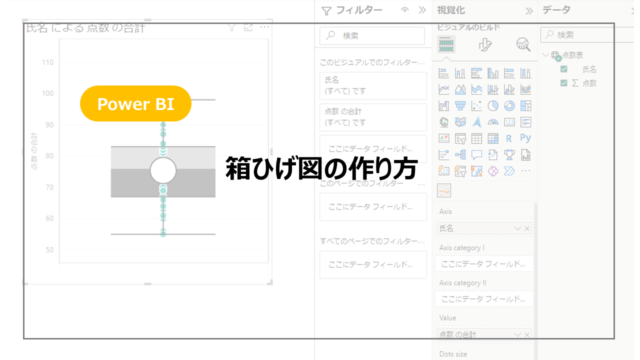
Power BI 箱ひげ図の作り方
2024年4月8日 ria DataSeeds~データエンジニアの備忘録~

Power BI
Power BI 前年比・前月比を表示する方法
2024年4月4日 ria DataSeeds~データエンジニアの備忘録~

Power BI
Power BI レーダーチャートの作り方
2024年3月3日 ria DataSeeds~データエンジニアの備忘録~

Power BI
Power BI 条件付き書式でデータバーを設定する方法
2024年2月26日 ria DataSeeds~データエンジニアの備忘録~

Power BI
Power BI 折れ線グラフに平均線を入れる方法
2024年2月19日 ria DataSeeds~データエンジニアの備忘録~

Power BI
Power BI テーブル・マトリックス 最大値・最小値を基準に背景色を設定する方法
2024年2月5日 ria DataSeeds~データエンジニアの備忘録~